Setting up EmonCMS for basic feeds to feed your dashboard
There are dozens or even hundreds of possible installation layouts. We therefore are not able to cover these as prebuild dashboards and feeds.
It's relatively easy to setup a feed in EmonCMS and to use this feed in your dashboard.
First you have to choose the decoder
When the data will be logged to EmonCMS the data looks unsorted and is hard to read. We created an decoder which you can select which will layout the data into understandable blocks.
To do that you have to go to the "Node" page:
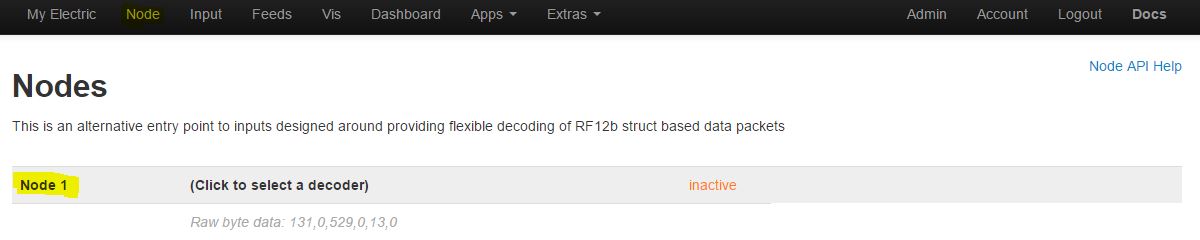
There you will find a list of nodes. The Nodes will carry the serial number of the inverters or the gateway.
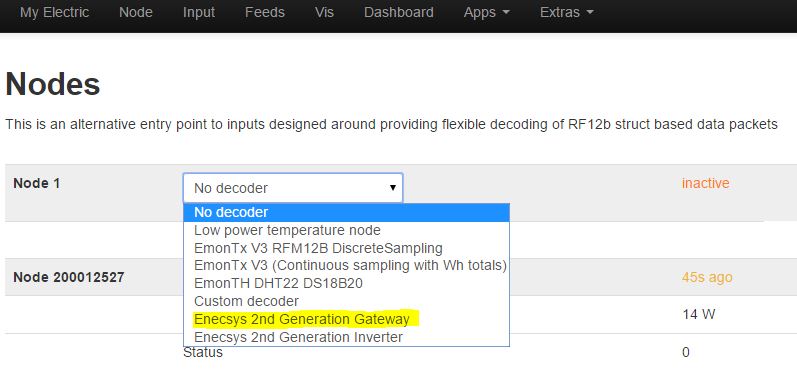
Search the serial number of the gateway and click on the "Click to select a decoder" text area. A dropdown menu will appear. Please select the Gateway decoder:
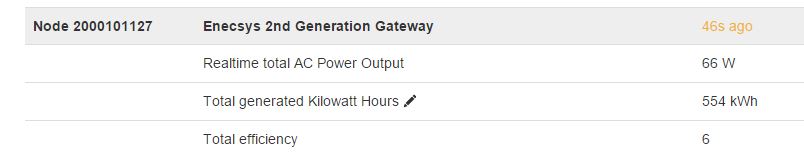
This will now transform the data into the following:
Do the same for all the inverters. Just choose the inverter decoder and will transform from the raw data to this:
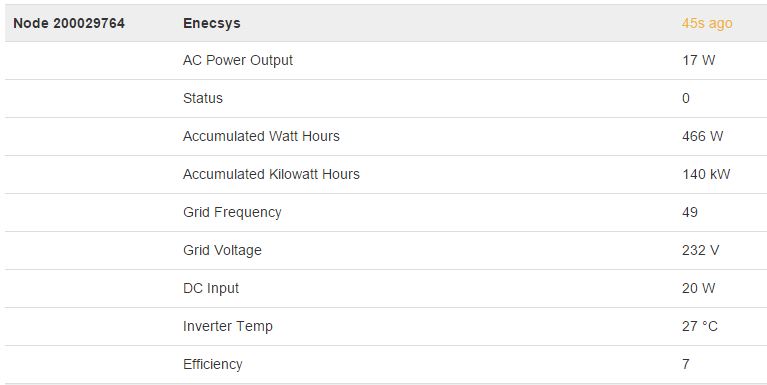
Do this for all your inverters and you already have a small text dashboard off all the data available.
This just decodes the data so tha we can setup feeds for the data we want to visualize. The dashboards needs feeds to show data. It's now up to you which feeds you want to create and what to visualize. That's the reason we can not cover any possible requirement in the basic package. It's beyond our possibility.
If you don't want to to do that on your own, we offer a dashboard creation service letzs have a look here.
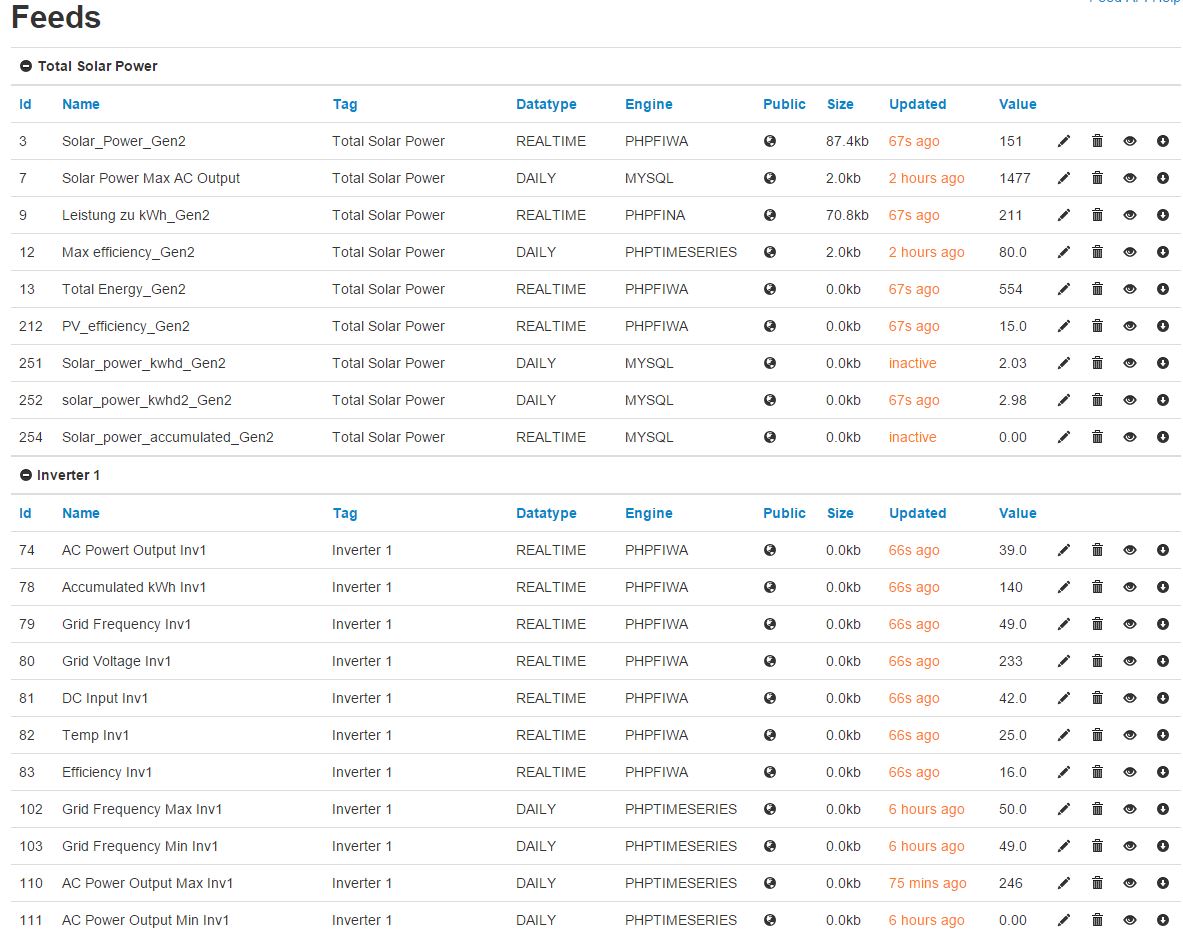
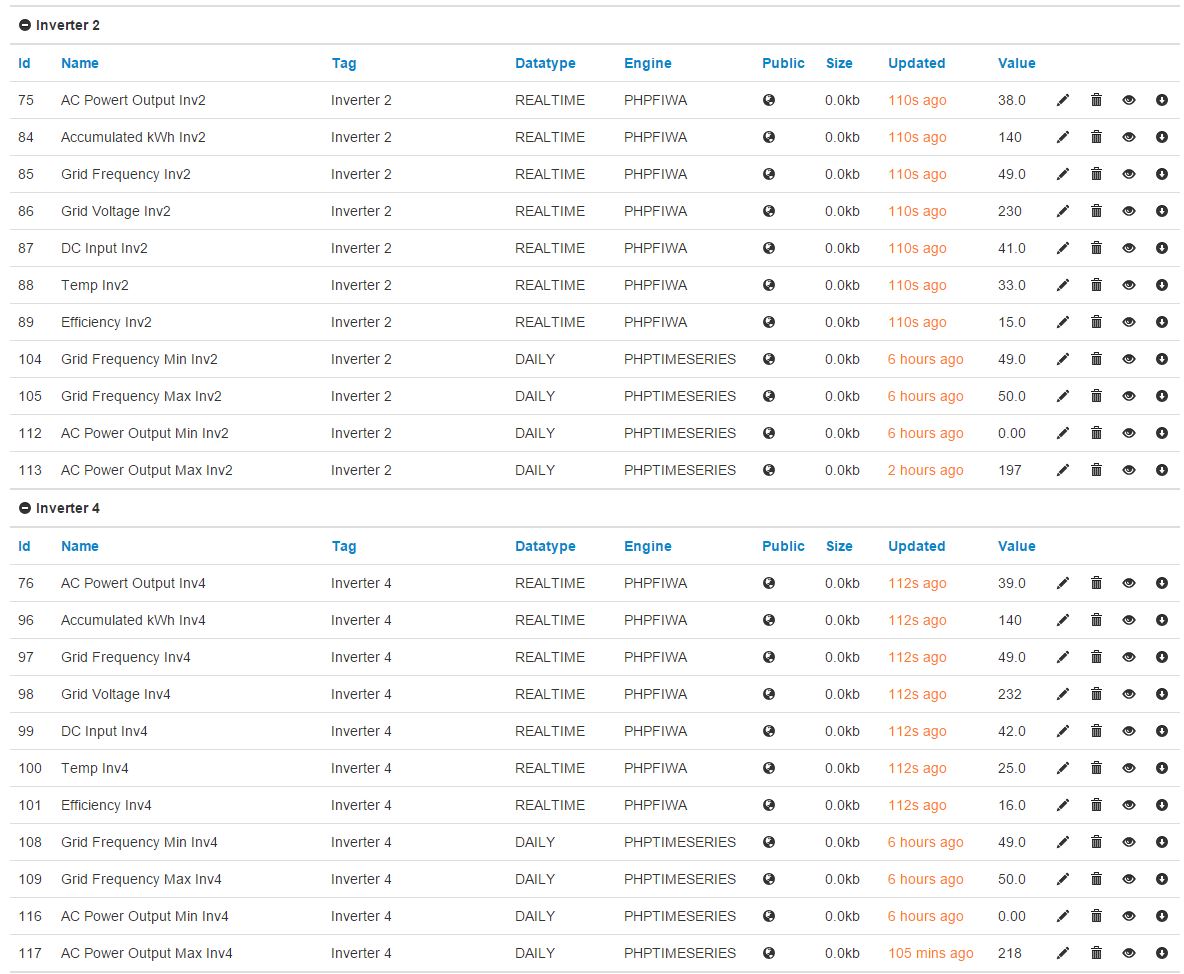
Setting up feeds
Feeds will log your data for specific needs. There are several feed types for different requirements. We will show just some examples for basic feeds to start your own dashboards.
To start creating feeds you have to click on the config button at the end of the data row you want to log.
If you want to log the AC Power Output you have to click on the config button at the end of this row. The following screen will appear:
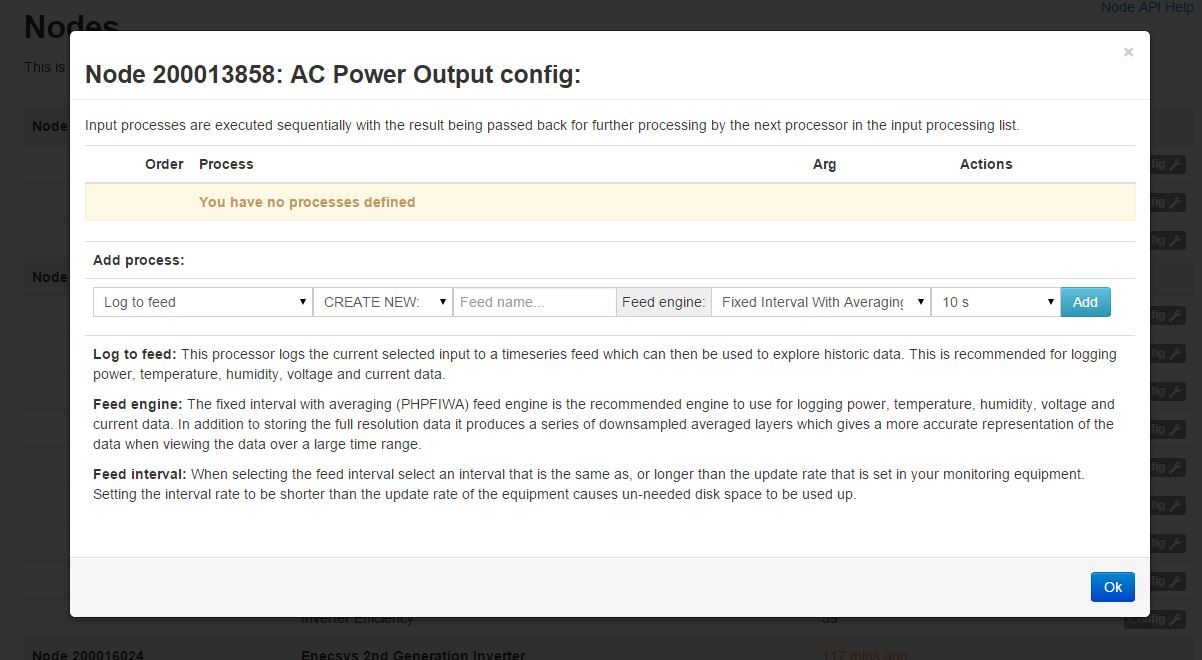
This screen shows the feed config for this data row. To add a feed you have to choose from the desired feeds by clicking on the "log to feed" dropdown box.
But as a rule, each data you want to visualize need the standard "log to feed" process. So just leave everything as it is and just type in a name for the feed in the "feed name" text box. Name it as clear as you can as you will end up with a lot of feeds in the end! Add it by clicking on the "Add" button.
That's it! From now on the data will be stored into this feed each time there is an update on the node data.
Do this with all the data you want to see on the dashboard! Name it clearly. if you have 12 Inverters and one Gateway you will have to setup 12 feeds for the inverters and one feed for the gateway data. Make a plan on what you want to see on the dashboard.
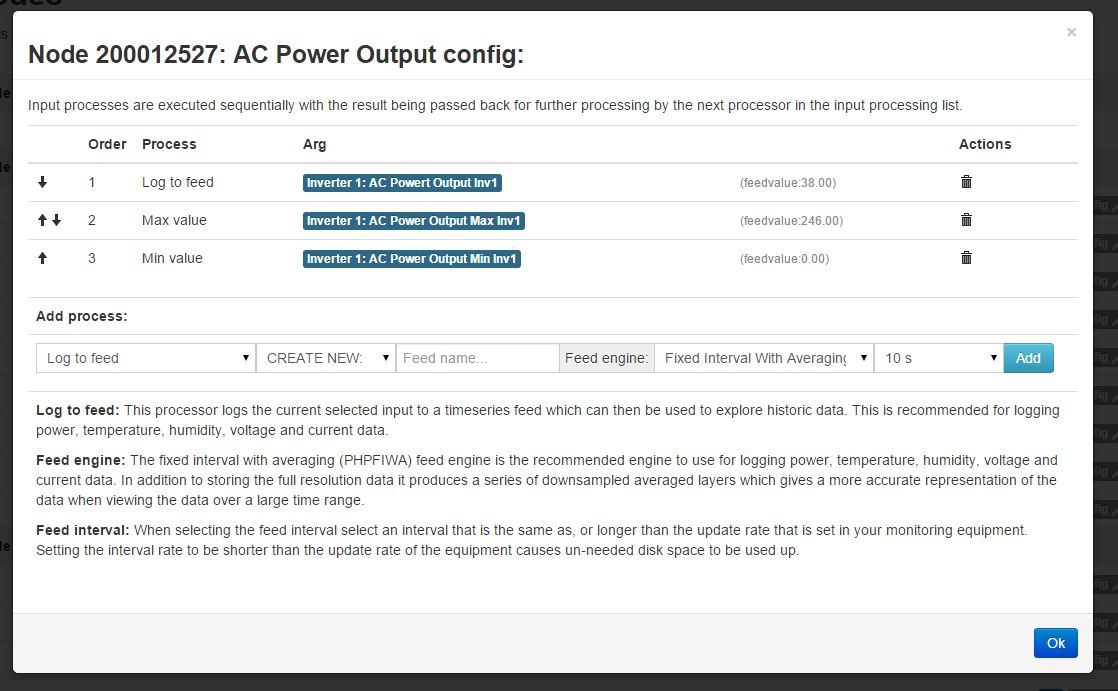
Extensive Feed configuration example:
Here you just see some of the feed configuration I did for my own 4 Panels setup. Make a plan on what you want to show on your dashboard. Just create feeds for what you need.
Creating a dashboard
Dashboards make it possible to create nicely layed out pages showing graphs, dials, text and other widgets. A dashboard can be made public and can be accessed via username.
For a more detailed explanation please view the Homepage of EmonCMS Dashboard section: http://emoncms.org/site/docs/dashboards