EmonCMS Portal
Emoncms is a powerful open-source web-app for processing, logging and visualising energy, temperature and other environmental data.
With the Swiss Solar Log enhanced firmware the gateway will deliver the following information every 120s.
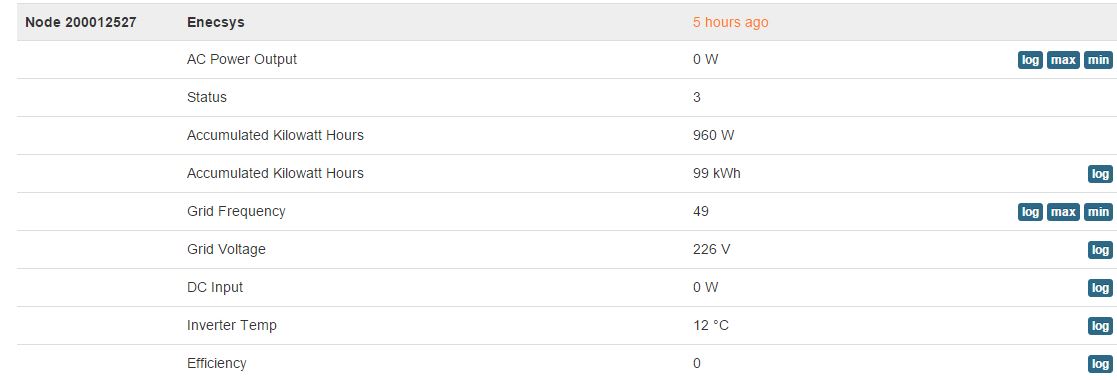
- Show AC Power Output per Inverter
- Show DC Power Input per Inverter
- Show Inverter Temp
- Show Grid Frequency per Inverter
- Show Grid Voltage per Inverter
- Show accumulated Watt and Kilowatt Hours per Inverter
- Show Efficiency per Inverter
- Show Status per Inverter
With all this information you can have a simple textual information like this:
Or you can create visual dashboards who help showing this data in a more convenient way.
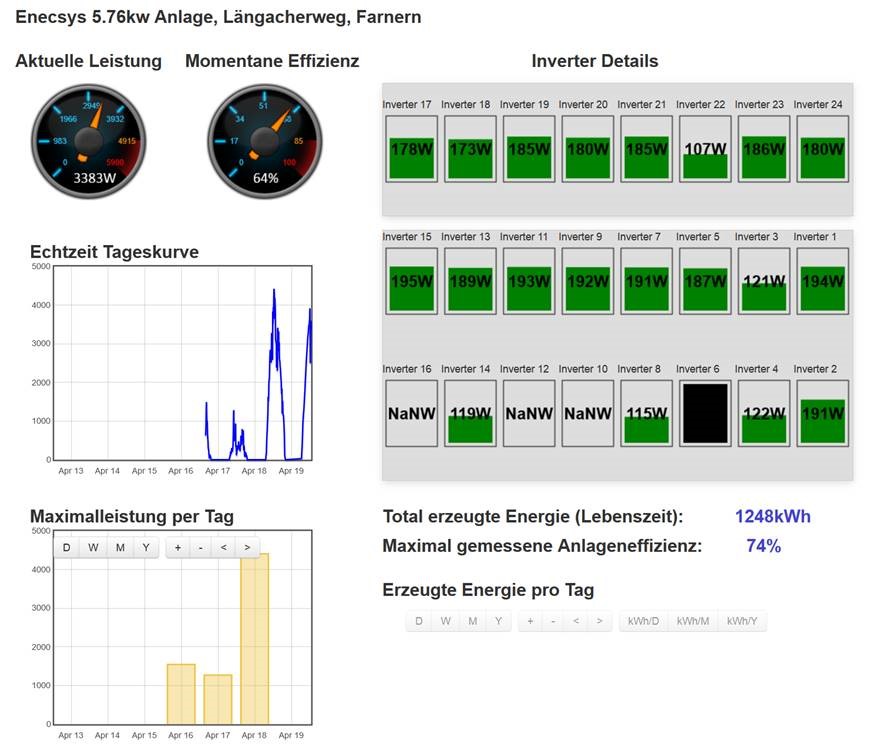
Here is an example of a Dashboard created for a system with 24 Inverters.
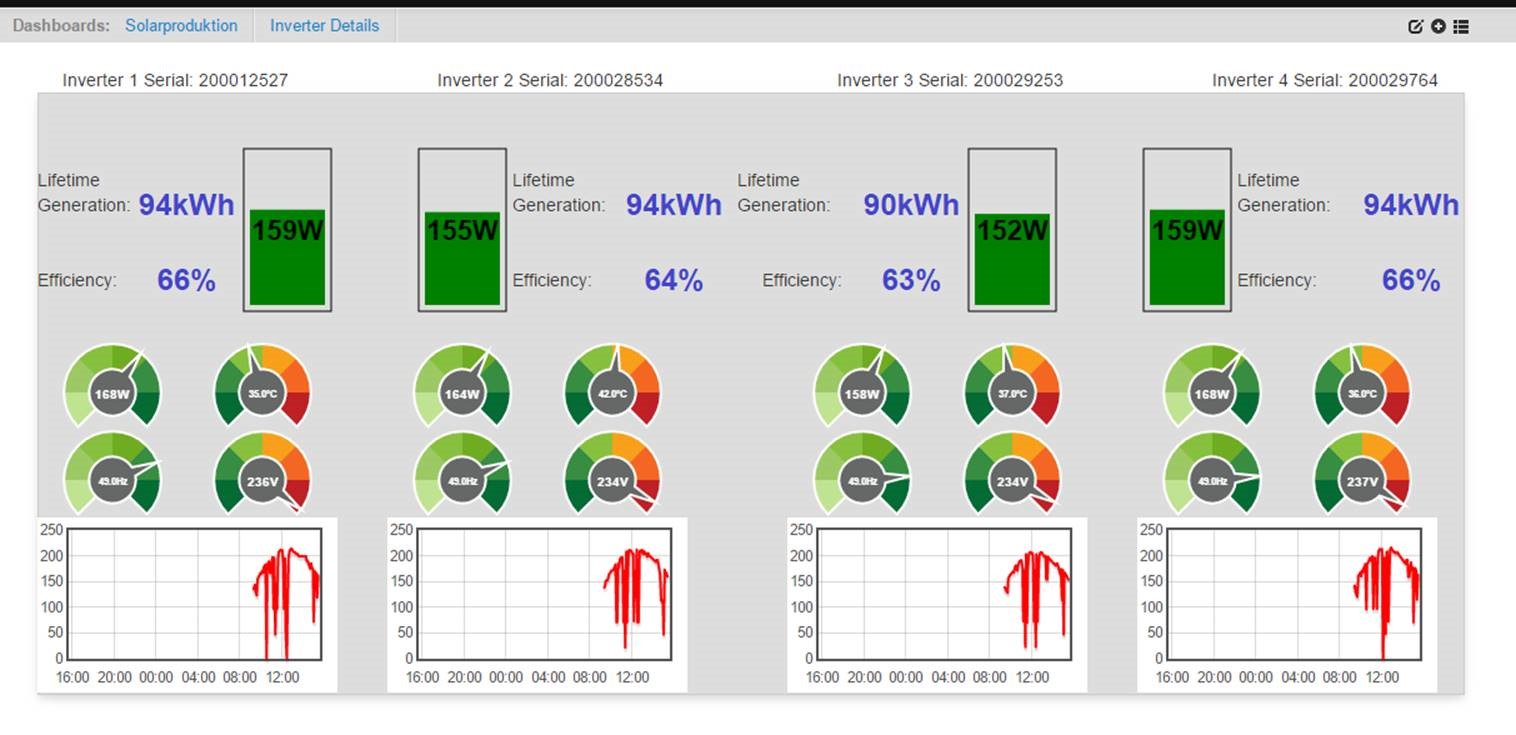
Here is an example of Andreas Messerli's 4 Inverter installation with enhanced information like inverter temp etc.:
The above examples are showing why it is necessary to have low level details of your installation. In the example with 24 inverters 4 of them have failed and we did't knew that. As soon as we had the reporting up and running we were able to follow the details of the inverters. In that case Inverter 16,12,10 and 6 have to be analyzed.
As you can see, with EmonCMS a lot is possible. It's up to you what you want to see and in what detail you need it.